THIS PAGE HAS BEEN MOVED TO SHAREPOINT!
Please refer to this site/make edits here for the most updated information: https://partnershealthcare.sharepoint.com/sites/LCN/SitePages/Overlaying-FSL-Feat-statistical-maps.aspx
Back to list of all tutorials
Back to course page
FslFeat Tutorial Homepage
Overlaying FSL Feat statistical maps
Preparations
In this exercise, the data set of subject bert is used for demonstration. Type the following prior to beginning the exercises:
If You're at an Organized Course
If you are taking one of the formally organized courses, everything has been set up for you on the provided laptop. The only thing you will need to do is run the following commands in every new terminal window (aka shell) you open throughout this tutorial. Copy and paste the commands below to get started:
export SUBJECTS_DIR=$TUTORIAL_DATA/buckner_data/tutorial_subjs
cd $SUBJECTS_DIR/fbert-feat
ln -s $FREESURFER_HOME/subjects/fsaverage
ln -s $FREESURFER_HOME/subjects/bert
To copy: Highlight the command in the box above, right click and select copy (or use keyboard shortcut Ctrl+c), then use the middle button of your mouse to click inside the terminal window (this will paste the command). Press enter to run the command.
These two commands set the SUBJECTS_DIR variable to the directory where the data is stored and then navigates into the subdirectory you'll be working in. You can now skip ahead to the tutorial (below the gray line).
If You're not at an Organized Course
If you are NOT taking one of the formally organized courses, then to follow this exercise exactly be sure you've downloaded the tutorial data set before you begin. If you choose not to download the data set you can follow these instructions on your own data, but you will have to substitute your own specific paths and subject names. These are the commands that you need to run before getting started:
## bash
<source_freesurfer>
export TUTORIAL_DATA=<path_to_your_tutorial_data>
export SUBJECTS_DIR=$TUTORIAL_DATA/buckner_data/tutorial_subjs
cd $SUBJECTS_DIR/fbert-feat
ln -s $FREESURFER_HOME/subjects/fsaverage
ln -s $FREESURFER_HOME/subjects/bert

## csh
source your_freesurfer_dir/SetUpFreeSurfer.csh
setenv TUTORIAL_DATA <path_to_your_tutorial_data>
setenv SUBJECTS_DIR $TUTORIAL_DATA/buckner_data/tutorial_subjs
cd $SUBJECTS_DIR/fbert-feat
ln -s $FREESURFER_HOME/subjects/fsaverage
ln -s $FREESURFER_HOME/subjects/bert
Information on how to source FreeSurfer is located here.
If you are not using the tutorial data you should set your SUBJECTS_DIR to the directory in which the recon(s) of the subject(s) you will use for this tutorial are located.
The subjects 'fsaverage' and 'bert' may already exist in the subjects directory, so ignore any warnings that might be issued that say 'File exists'.
1.0 Overlaying the statistical map onto the bert's orig volume
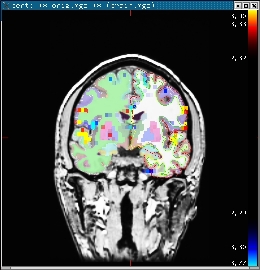
Use the following command to display the zmap (zstat1.nii.gz) from the first run overlaid onto the bert's orig volume. It will display the automatic segmentation, and will also set the threshold at z = 2.3:
 tkmedit bert orig.mgz lh.white -aux brain.mgz \
   -overlay ./fbert1.feat/stats/zstat1.nii.gz \
   -overlay-reg ./fbert1.feat/reg/freesurfer/anat2exf.register.dat \
   -segmentation aparc+aseg.mgz  -fthresh 2.3 -fmax 4.3
You should see the image below:

When you click or mouse over a voxel, the cortical or subcortical structure that that voxel belongs to will be displayed in the control panel. You can view any of the volumes in the stats dir in this way as well as the clustered maps in the feat directory.
2.0 View statistical maps on bert's surface
To view any of the statistical maps on bert's surface, close the tkmedit GUI (or open a new terminal window) and run:
tksurfer bert lh inflated \
  -overlay ./fbert1.feat/stats/zstat1.nii.gz \
  -overlay-reg ./fbert1.feat/reg/freesurfer/anat2exf.register.dat \
  -fthresh 2.3 -fmid 3.3 -fslope 1 -annot aparc.annot
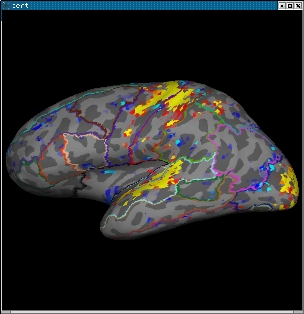
Change the cortical parcellation to outline mode with View->LabelStyle->Outline. You should see the image below:

When you click or mouse over a vertex, the control panel will display the name of the cortical structure. You can view any of the volumes in the stats dir in this way as well as the clustered maps in the feat directory. You can also run the tkmedit and tksurfer commands above in separate shells and use the Save-Point/Goto-Point functionality to navigate through the volume and surface.
3.0 Displaying Same-Subject, Cross-Run GFEAT Results
Typically, one collects more than one run/series of functional data for each subject. The individual runs are analyzed separately, then combined in standard space with GFEAT using a fixed-effects model. Since the data are no longer in the subject's native functional space, a different registration matrix is needed to map the GFEAT results to the individual. Each run of reg-feat2anat will create a reg/freesurfer/anat2std.register.dat. Any one of these can be used to map the GFEAT data to the subject's anatomy.
First, verify that the registration is good with:
tkregister2 --mov fbert.gfeat/mean_func.nii.gz --surf \
  --reg fbert1.feat/reg/freesurfer/anat2std.register.dat
mean_func.nii.gz is the mean of the example_func's in standard space. Since this is the mean func, it will be blurry if you have spatially smoothed. Note: if there is a problem with this registration, you need to repair the registrations for each individual run.
Now show gfeat results on anatomical volume:
tkmedit bert orig.mgz -seg aparc+aseg.mgz \
  -ov fbert.gfeat/cope1.feat/stats/zstat1.nii.gz \
  -ovreg fbert1.feat/reg/freesurfer/anat2std.register.dat \
  -fthresh 2.3 -fmax 4.3
Here we've used the anat2std.register.dat from the first run.
Now show gfeat results on the surface:
tksurfer bert lh inflated -annot aparc.annot \
  -ov fbert.gfeat/cope1.feat/stats/zstat1.nii.gz \
  -ovreg fbert1.feat/reg/freesurfer/anat2std.register.dat \
  -fthresh 2.3 -fmid 3.3 -fslope 1
Back to list of all tutorials
Back to course page
FslFeat Tutorial Homepage
