|
Size: 3104
Comment:
|
Size: 3072
Comment: converted to 1.6 markup
|
| Deletions are marked like this. | Additions are marked like this. |
| Line 1: | Line 1: |
| [wiki:Self:FsTutorial top] | [wiki:Self:FsTutorial/FuncOverlay previous] | [[FsTutorial|top]] | [[FsTutorial/FuncOverlay|previous]] |
| Line 3: | Line 3: |
| *To follow this exercise exactly be sure you've downloaded the [wiki:Self:FsTutorial/Data tutorial data set] before you begin. If you choose not to download the data set you can follow these instructions on your own data, but you will have to substitute your own specific paths and subject names. | *To follow this exercise exactly be sure you've downloaded the [[FsTutorial/Data|tutorial data set]] before you begin. If you choose not to download the data set you can follow these instructions on your own data, but you will have to substitute your own specific paths and subject names. |
| Line 13: | Line 13: |
| Qmedit is simply a front-end for [wiki:Self:FsTutorial/Tools tkmedit], with some extra specifications for displaying overlays. In this command line, the {{{-o}}} option indicates the overlay, and the {{{-r}}} option specifies a registration matrix (usually use the same matrix that aligns the functional volumes with the anatomical reference). [wiki:Self:FsTutorial/Tools Tkmedit] should start and display something like the following: | Qmedit is simply a front-end for [[FsTutorial/Tools|tkmedit]], with some extra specifications for displaying overlays. In this command line, the {{{-o}}} option indicates the overlay, and the {{{-r}}} option specifies a registration matrix (usually use the same matrix that aligns the functional volumes with the anatomical reference). [[FsTutorial/Tools|Tkmedit]] should start and display something like the following: |
| Line 15: | Line 15: |
| attachment:qmedit-up.jpg attachment:qmedit-down.jpg |
{{attachment:qmedit-up.jpg}} {{attachment:qmedit-down.jpg}} |
| Line 26: | Line 26: |
| * '''Threshold minimum / midpoint / slope''' configures the colormap. {{{Min}}} specifies the threshold below which values will be transparent, or not visually represented on the overlay. {{{mid}}} defaults to orange, {{{max}}} defaults to yellow, and all values above this are drawn in yellow as well. {{{max}}} is determined by the {{{slope}}} value according to: {{{max = (1.0/slope) + mid }}} [[BR]] | * '''Threshold minimum / midpoint / slope''' configures the colormap. {{{Min}}} specifies the threshold below which values will be transparent, or not visually represented on the overlay. {{{mid}}} defaults to orange, {{{max}}} defaults to yellow, and all values above this are drawn in yellow as well. {{{max}}} is determined by the {{{slope}}} value according to: {{{max = (1.0/slope) + mid }}} <<BR>> |
To follow this exercise exactly be sure you've downloaded the tutorial data set before you begin. If you choose not to download the data set you can follow these instructions on your own data, but you will have to substitute your own specific paths and subject names.
Visualizing the parametric map overlayed onto structural data
To load the parametric map of brain activation as an overlay onto the FreeSurfer anatomical data, run these commands:
cd $FREESURFER_HOME/subjects/buckner_data/tutorial_subjs
setenv SUBJECTS_DIR ${PWD}
qmedit -o ./spm001.img -r ./register.dat
Qmedit is simply a front-end for tkmedit, with some extra specifications for displaying overlays. In this command line, the -o option indicates the overlay, and the -r option specifies a registration matrix (usually use the same matrix that aligns the functional volumes with the anatomical reference). Tkmedit should start and display something like the following:
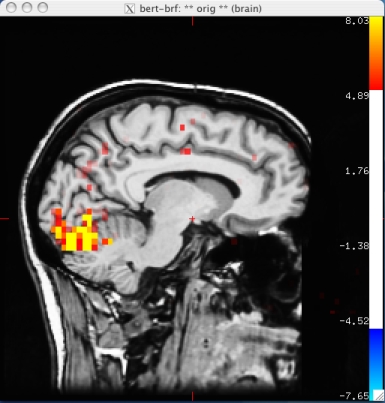
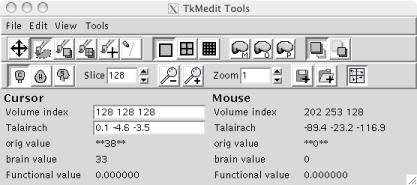
Coronal, saggital and horizontal (axial) views can be displayed in the image window by clicking the labeled buttons on the GUI, and different slices in the volume are selected changing the value of Slice. Zooming in and out on the image window are accomplished with either clicking the labeled buttons or changing the numerical value.
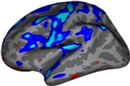
As mentioned previously, the overlay's colormap is by convention and default a "heat" scale, with blue to cyan indicating increasingly negative values, and red to yellow indicating higher positive values. The overlay can be turned off by checking the View->Functional Overlay option.
To modify other aspects of the colormap, explore the options in View->Configure->Functional Overlay:
Reverse values will display negative values in warmer colors, and positive values in cool ones;
Grayscale will use a greyscale color scale instead of the normal blue to red heat scale. The most negative values will be shown in black and the most positive values in white;
Opaque will cause the overlay to be completely opaque;
Threshold minimum / midpoint / slope configures the colormap. Min specifies the threshold below which values will be transparent, or not visually represented on the overlay. mid defaults to orange, max defaults to yellow, and all values above this are drawn in yellow as well. max is determined by the slope value according to: max = (1.0/slope) + mid
In all cases,the Apply button must be clicked in order for the changes to take effect.
The View->Mask to Functional Overlay option effectively masks the anatomical volume with the opaque regions in the overlay volume. Using this option and turning off the overlay may yield a better sense of which anatomical regions were active during the study. (this option may not currently work well.)