| Deletions are marked like this. | Additions are marked like this. |
| Line 12: | Line 12: |
| The following labels [[https://surfer.nmr.mgh.harvard.edu/pub/dist/ba_labels_fsaverage.tar.gz|are available for download]] (and already included in Freesurfer v4.0.3 and later) for display on the 'fsaverage' surface distributed with Freesurfer: | The following labels [[https://surfer.nmr.mgh.harvard.edu/pub/dist/ba_labels/ba_labels_fsaverage.tar.gz|are available for download]] (and already included in Freesurfer v4.0.3 and later) for display on the 'fsaverage' surface distributed with Freesurfer: |
| Line 27: | Line 27: |
| Copy the file [[http://surfer.nmr.mgh.harvard.edu/pub/dist/ba_labels_fsaverage.tar.gz|ba_labels_fsaverage.tar.gz]] to your $FREESURFER_HOME/subjects/fsaverage/labels directory, then type {{{tar zxvf ba_labels_fsaverage.tar.gz}}} to extract. To view a label, open an inflated surface ({{{tksurfer fsaverage lh inflated}}}) and then select {{{File->Label->Load Label}}} and select a label (lh.BA1.label, for example). Then select {{{Tools->Labels->Copy Label Statistics to Overlay}}}. Then select {{{View->Configure->Overlay}}} and set Min threshold to 0 and Max threshold to 0.5, and also select Linear threshold, and then press Apply and Close. The label should appear on the surface (you will probably need to press the Redraw button). Only one label at a time can be displayed. The labels show the frequency estimates of the probability that each (displayed) point was part of that BA. | Copy the file [[http://surfer.nmr.mgh.harvard.edu/pub/dist/ba_labels/ba_labels_fsaverage.tar.gz|ba_labels_fsaverage.tar.gz]] to your $FREESURFER_HOME/subjects/fsaverage/labels directory, then type {{{tar zxvf ba_labels_fsaverage.tar.gz}}} to extract. To view a label, open an inflated surface ({{{tksurfer fsaverage lh inflated}}}) and then select {{{File->Label->Load Label}}} and select a label (lh.BA1.label, for example). Then select {{{Tools->Labels->Copy Label Statistics to Overlay}}}. Then select {{{View->Configure->Overlay}}} and set Min threshold to 0 and Max threshold to 0.5, and also select Linear threshold, and then press Apply and Close. The label should appear on the surface (you will probably need to press the Redraw button). Only one label at a time can be displayed. The labels show the frequency estimates of the probability that each (displayed) point was part of that BA. |
| Line 33: | Line 33: |
| Data and scripts [[http://surfer.nmr.mgh.harvard.edu/pub/dist/V1_average-1.1.tgz|are available here]] to allow prediction of location V1 on a Freesurfer subject based on a probabilistic atlas. See [[http://surfer.nmr.mgh.harvard.edu/pub/dist/V1_average.README.txt|the README file]] for instructions. See the O. Hinds paper 'Accurate prediction of V1 location from cortical folds in a surface coordinate system', in References below, for details. | Data and scripts [[http://surfer.nmr.mgh.harvard.edu/pub/dist/V1_average/V1_average-1.1.tgz|are available here]] to allow prediction of location V1 on a Freesurfer subject based on a probabilistic atlas. See [[http://surfer.nmr.mgh.harvard.edu/pub/dist/V1_average/V1_average.README.txt|the README file]] for instructions. See the O. Hinds paper 'Accurate prediction of V1 location from cortical folds in a surface coordinate system', in References below, for details. |
Brodmann Area Maps (BA Maps)
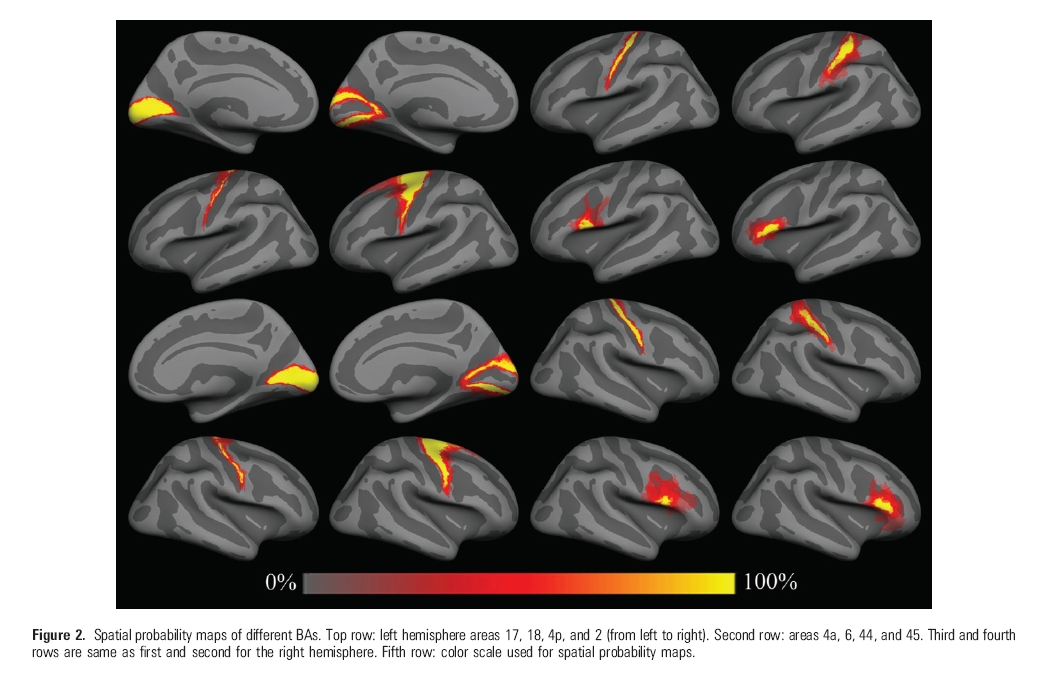
The Martinos Center for Biomedical Imaging and the Institute of Neurosciences and Biophysics (INB) have created an atlas of a subset of the Brodmann Areas, for usage in Freesurfer. The subject set consists of 10 neurologicially normal subjects.

Download
Note: maps are for neuroscientific purposes only! (no commercial use)
BA Labels
The following labels are available for download (and already included in Freesurfer v4.0.3 and later) for display on the 'fsaverage' surface distributed with Freesurfer:
BA 1 - somatosensory area
BA 2 - somatosensory area
BA 3a - somatosensory area
BA 3b - somatosensory area
BA 4a - primary motor area (anterior)
BA 4p - primary motor area (posterier)
BA 6 - pre-motor area
BA 44 - Broca's area (pars opercularis)
BA 45 - Broca's area (pars triangularis)
V1 (BA 17) - primary visual area
V2 (BA 18) - secondary visual area
V5/MT - visual area, middle temporal
Copy the file ba_labels_fsaverage.tar.gz to your $FREESURFER_HOME/subjects/fsaverage/labels directory, then type tar zxvf ba_labels_fsaverage.tar.gz to extract. To view a label, open an inflated surface (tksurfer fsaverage lh inflated) and then select File->Label->Load Label and select a label (lh.BA1.label, for example). Then select Tools->Labels->Copy Label Statistics to Overlay. Then select View->Configure->Overlay and set Min threshold to 0 and Max threshold to 0.5, and also select Linear threshold, and then press Apply and Close. The label should appear on the surface (you will probably need to press the Redraw button). Only one label at a time can be displayed. The labels show the frequency estimates of the probability that each (displayed) point was part of that BA.
BA Atlas
A probabilistic atlas for use in automatic cortical parcellation of these areas will be available at a future date.
V1 Atlas
Data and scripts are available here to allow prediction of location V1 on a Freesurfer subject based on a probabilistic atlas. See the README file for instructions. See the O. Hinds paper 'Accurate prediction of V1 location from cortical folds in a surface coordinate system', in References below, for details.
References
Cortical Folding Patterns and Predicting Cytoarchitecture, Fischl, B., N. Rajendran, E. Busa, J. Augustinack, O. Hinds, B.T.T. Yeo, H. Mohlberg, K. Amunts, K. Zilles, (2007). Cerebral Cortex 2007, doi:10.1093/cercor/bhm225.
Accurate prediction of V1 location from cortical folds in a surface coordinate system, Hinds, O.P., N. Rajendran, J.R. Polimeni, J.C. Augustinack, G. Wiggins, L.L. Wald, H.D. Rosas, A. Potthast, E.L. Schwartz and B. Fischl (2007). NeuroImage 2007.10.033.
- Quantitative analysis of cyto- and receptor architecture of the human brain, Zilles K, Schleicher A, Palomero-Gallagher N, Amunts K (2002). Brain Mapping: The Methods, edited by J. C. Mazziotta and A. Toga, USA: Elsevier, 2002, p. 573-602.
Cytoarchitecture of the cerebral cortex - more than localization, Amunts K, Schleicher A, Zilles K (2007). NeuroImage 37:1061-1065.
- Towards multimodal atlases of the human brain, Toga AW, Thompson PM, Mori S, Amunts K, Zilles K (2006). Nature Neuroscience Reviews, 7(12):952-966.
- Gender-specific left-right asymmetries in human visual cortex, Amunts K, Armstrong E, Malikovic A, Hoemke L, Mohlberg H, Schleicher A, Zilles K (2007). The Journal of Neuroscience, 27(6):1356-1364.
